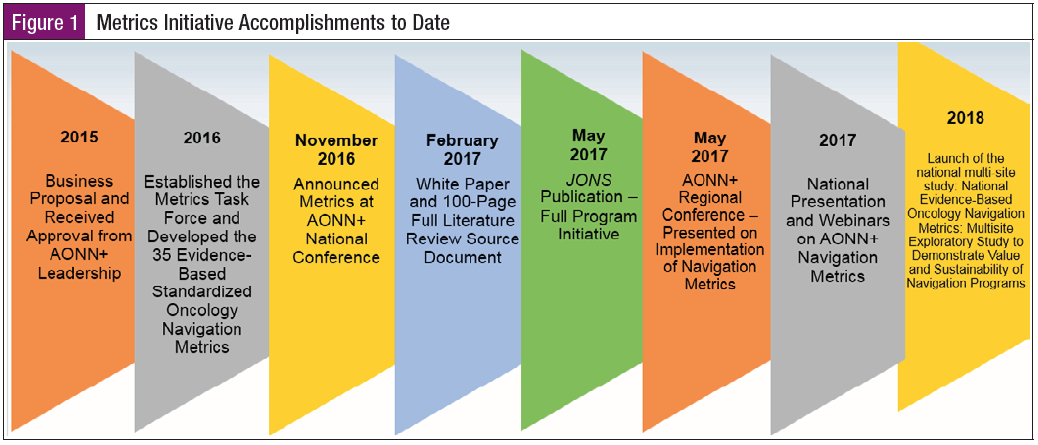
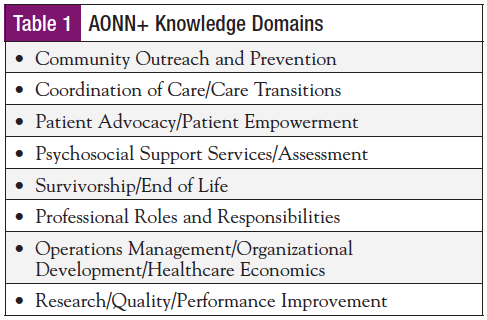
The first discussions about value-based metrics development for oncology navigation took place in November 2015 at the Academy of Oncology Nurse & Patient Navigators (AONN+) Annual Conference. Key stakeholders within the AONN+ membership identified an opportunity to develop quality outcome measures for navigation. It was recognized that the landscape of healthcare continued to evolve and focus on quality care measures and outcomes that impact reimbursement. A proposal for the metrics development initiative was presented by the AONN+ Leadership Council and approved and funded by The Lynx Group in December 2015 (Figure 1). In January 2016, the initiative was launched, led by Project Team Leader Tricia Strusowski, MS, RN, and Co-Project Team Leaders Elaine Sein, BSN, RN, and Danelle Johnston, MSN, RN, ONN-CG, OCN. A project team of content experts was organized. This multidisciplinary team of 10 members was formed to create standardized navigation metrics focused on patient experience (PE), clinical outcomes (CO), and return on investment (ROI) utilizing the AONN+ knowledge domains as the framework for the metrics development (Table 1).
The project team leaders held a Webex to roll out the project, time lines, and expectations of each team member and outlined the preparation required prior to the retreat. Each member completed a literature review on the assigned domain for which they had validated expertise. The metrics team used measure development criteria ensuring feasibility, meaningfulness, and breadth of metric to attain reliability and validity. AONN+ held a 1-day retreat with the task force members to review metrics, literature support, and benchmarks for each domain and finalize a set of standard metrics. Using a Likert scale, the team ranked metrics to determine which met rigorous review and were acknowledged as being of high validity that all navigation programs can utilize.
The creation of these standardized national metrics to measure programmatic success is vital to coordinating high-quality, team-based care and demonstrating the sustainability of navigation programs. It is imperative that oncology nurse and patient navigators understand that active participation in data collection, analytics, and reporting outcomes are not added responsibilities but are already a part of the professional role. The implications for navigation practices using quality navigation measures are that they are transformative, evaluate professional practice and care delivery, define oncology navigation practice and outcomes, and are necessary for sustainability of navigation.1-3
The outcome of this initial work was the publication of 35 standardized, evidence-based, oncology navigation metrics. To view the measures in their entirety, please reference the AONN+ Standardized Metrics Source Document (www.aonnonline.org/metrics-source-document). To read the full project implementation, please access the May 2017 issue of the Journal of Oncology Navigation & Survivorship (www.jons-online.com/issue-archive/2017-issues/may-2017-vol-8-no-5).
AONN+ recognizes that navigation programs are developing at different rates within diverse structural organizations and settings that will determine which standardized metrics will be essential to measure outcomes for their specific navigation program. As disease-specific certification evolves, additional evidence-based disease-specific metrics will need to be developed to dovetail into the standardized navigation metrics.
The US healthcare system is the costliest in the world. It is projected that by 2026, 20% of the gross national product will be spent on healthcare.4 In light of the growing aging populations and chronic health conditions, there is a global challenge to provide cost-effective quality healthcare. The landscape of healthcare has shifted, driven by the Triple Aim to reduce cost per capita in healthcare, improve the patient experience of care, and advance health outcomes. It is essential for outcomes to be driven by standardized evidence-based metrics that can effectively be measured with the application of data analytics and implementation of performance improvement initiatives. National standards with value-based care are now propelling cancer programs to be accountable and measure both quality of care delivery and cost.
Quality care is defined by the Institute of Medicine (IOM) as the “Degree in which health services [knowledge] for individuals and populations increase the likelihood of desired health outcomes and are consistent with current professional knowledge [research evidence].”5
The IOM has identified gaps in cancer quality care—gaps in existing measures; challenges with measure development; lack of consumer engagement in measure development and reporting; and data to support meaningful, timely, actionable performance measures.6 IOM stated, “To ensure the rapid translation of research into practice, a mechanism is needed to quickly identify the results of research with quality-of-care implications and ensure that it is applied in monitoring quality.”7 Providers, including healthcare systems, health plans, physicians, program administrators, and navigators, must be held accountable for demonstrating that they provide and improve quality of care through quality measures. A core set of indicators needs to be collected to measure and monitor quality of care that spans the continuum of cancer care.7
Jojola and colleagues completed a systematic review of literature evaluating 15 peer-reviewed articles assessing patient navigation efficacy for cancer patients undergoing treatment. The review identified the need for heterogeneity; a consistent way in which data are reported to allow for better assessments in research. The authors also acknowledged the need for metrics to evaluate the outcomes of patient navigation throughout the cancer care trajectory to assess its effectiveness. Jojola et al stated, “Improving standardization of patient navigation metrics would allow clinicians, policy makers, patients, and other researchers to better measure the impact of patient navigation across the continuum of cancer care.”8 It is imperative for navigation to continue to build a strong sustainable business case through the collection, measurement, and reporting of the 35 newly established standardized metrics. Harnessing the power of this information to create best practices will elevate navigation and garner industry support for advancing patient-centered care delivery.
The AONN+ standardized oncology navigation metrics focus on PE, CO, and ROI that align with national oncology standards and indicators. These national standards and indicators are defined by the Commission on Cancer (CoC) National Accreditation Program, the National Accreditation Program for Breast Centers (NAPBC), the Oncology Care Model (OCM), the Quality Oncology Practice Initiative (QOPI), and the Medicare Access and CHIP Reauthorization Act (MACRA). AONN+ developed a crosswalk taking the 35 standardized metrics and identifying how these measures align with the national standards and indicators. A complete list of those national standards that support AONN+ metrics follows this article. Additional background data are provided to define the national standards and indicators and how these dovetail with AONN+ metrics. Administrators, providers, and navigators need to be harmonizing to see how the national measures and indicators align and work in metric synergy. Through the cancer program goals, they can identify national standards and indicators that cross the cancer care trajectory, creating strong metrics that do not cause metric silos.
Oncology National Standards
and Measures
CoC
Over the past 80 years, the CoC has been engaged in definition and recognition of quality cancer care. The emphasis is on improving overall survival and quality of life for cancer patients that addresses standard-setting to advance cancer prevention, research, education, and monitoring of quality care delivery.9 The CoC initiatives are currently led by 56 representatives from professional organizations. The CoC has established patient-centered standards and quality measures to support delivery of multidisciplinary delivery of high-quality cancer care. The National Cancer Database is utilized by the CoC to collect, analyze, and report cancer program data.10 Both the Cancer Program Practice Profile Reports and the Rapid Quality Reporting System are used to facilitate real-time reporting, auditing, and updating of data.
Currently, there are approximately 1500 CoC national accredited programs across the United States and Puerto Rico. The accreditation focuses programs to improve their quality of care delivery through the implementation of national standards and measures. The focus on cancer care delivery starts at prevention and moves through the cancer care continuum into survivorship and end of life. There are 5 areas of focus: (1) Program Management, (2) Clinical Services, (3) Continuum of Care Services, (4) Patient Outcomes, and (5) Data Quality, with a total of 34 standards that are evaluated within the accreditation process. The CoC Cancer Program Standards: Ensuring Patient-Centered Care can be accessed on the CoC website.11
NAPBC
The NAPBC is a consortium of national professional organizations committed to the improvement of quality care and monitoring outcomes (Table 2). The 3 pillars focus on standard-setting, scientific validation, and patient and professional education. The 6 domains focus on (1) Center Leadership, (2) Clinical Services, (3) Research, (4) Community Outreach, (5) Professional Outreach, and (6) Quality Improvement.12 A total of 26 quality standards are required for programs to demonstrate successful achievement.
OCM
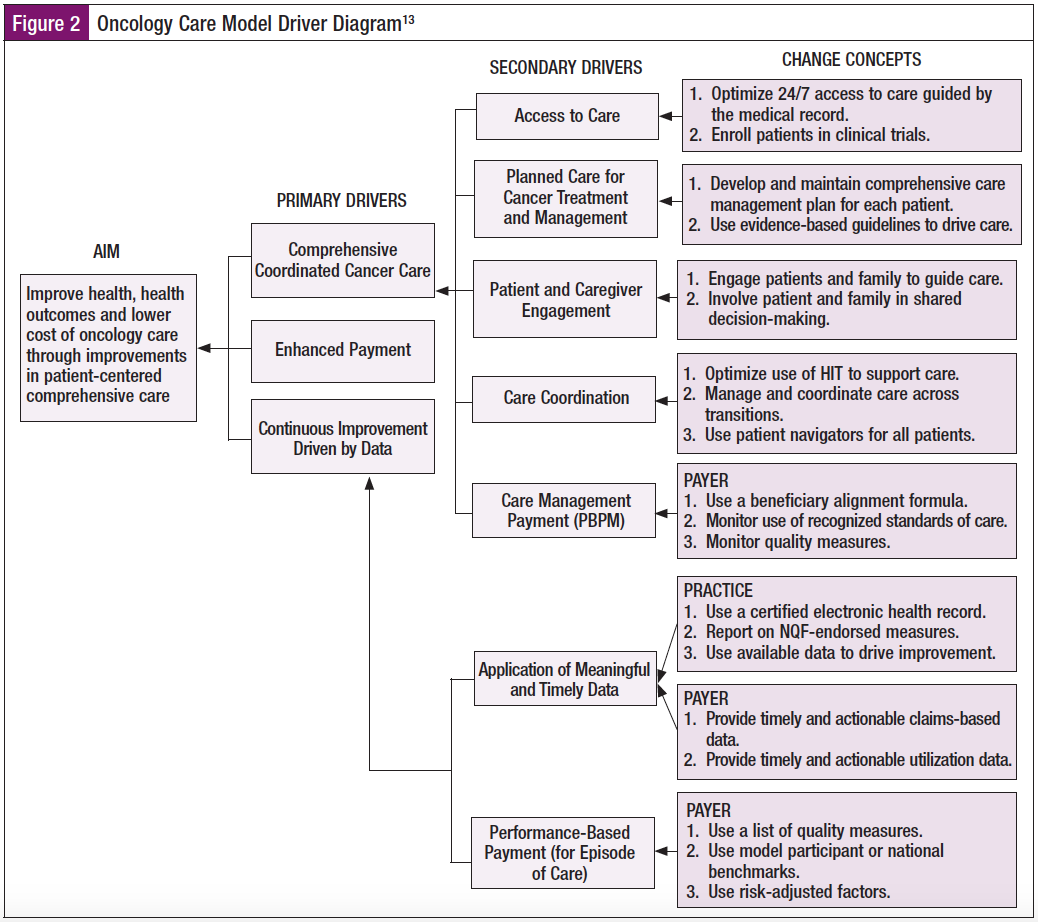
The Centers for Medicare & Medicaid Services (CMS) has designed new episode-based payment and care delivery models with the outcome to drive improvement in overall health outcomes and high-quality care and provide highly coordinated care at the same or lower cost for oncology patients (Figure 2). This 5-year model, launched July 1, 2016, and ending June 30, 2021, will be evaluating episodes of care that include chemotherapy at 6-month intervals. Participating in the OCM are 184 practices and 13 payers.14 The goal is to drive practice transformation utilizing aligned financial incentives that include performance-based considerations, which increase value of services while decreasing unnecessary utilization of services.
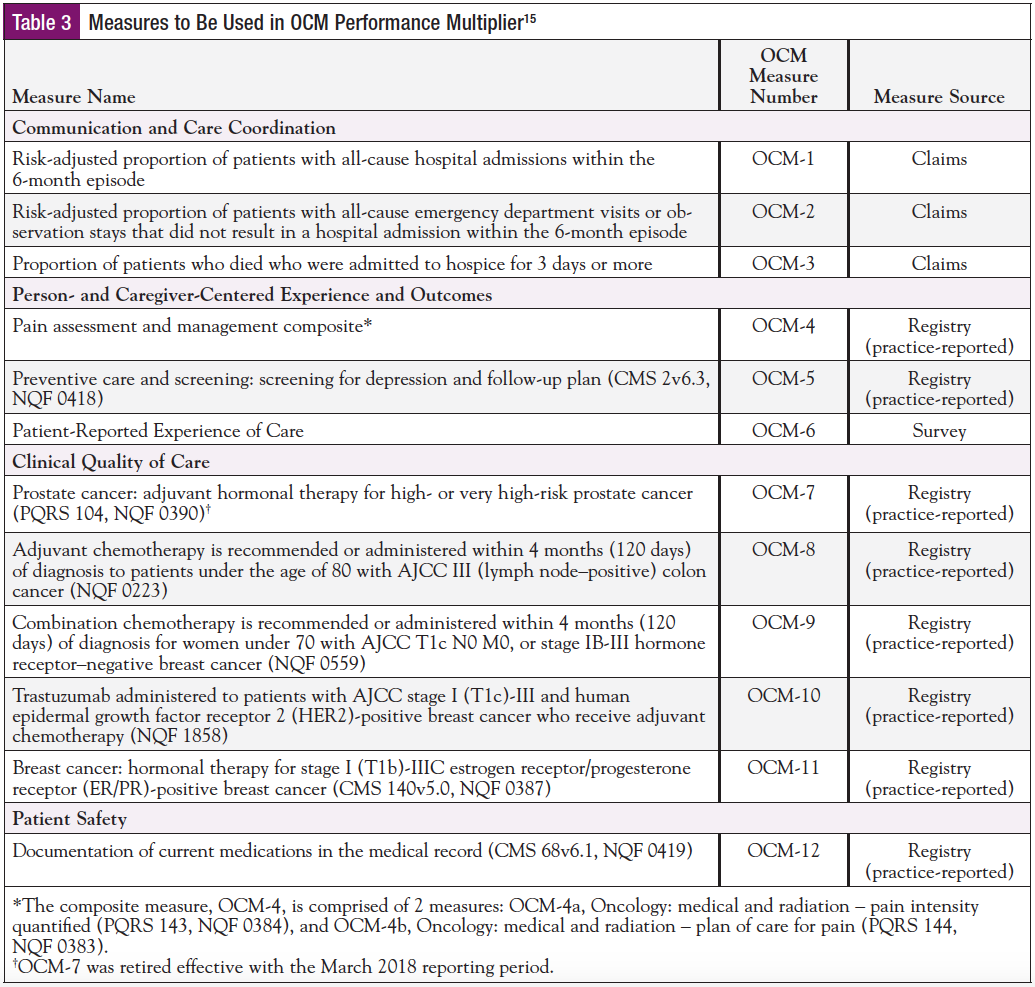
The model was designed utilizing the National Quality Strategy, which focused on 4 quality measures: (1) Communication and care coordination, (2) Person- and caregiver-centered experience, (3) Clinical quality-care outcomes, and (4) Patient safety. The 4 measures align with the standardized metrics developed by AONN+ focused on PE, CO, and ROI. See Table 3 for the 12 quality measures that impact performance-based payment and are measured and reported at quarterly intervals to drive continuous quality improvement and identify best practices.15
QOPI
QOPI was initiated in 2010 to enhance the services provided to the oncology patients by raising the quality of care provided and monitored in the oncology medical and hematology oncology physicians’ offices.16 QOPI surveys the individual practices in over 100 different measures. The metrics follow national guidelines and incorporate services that provide exceptional care for the cancer patient.
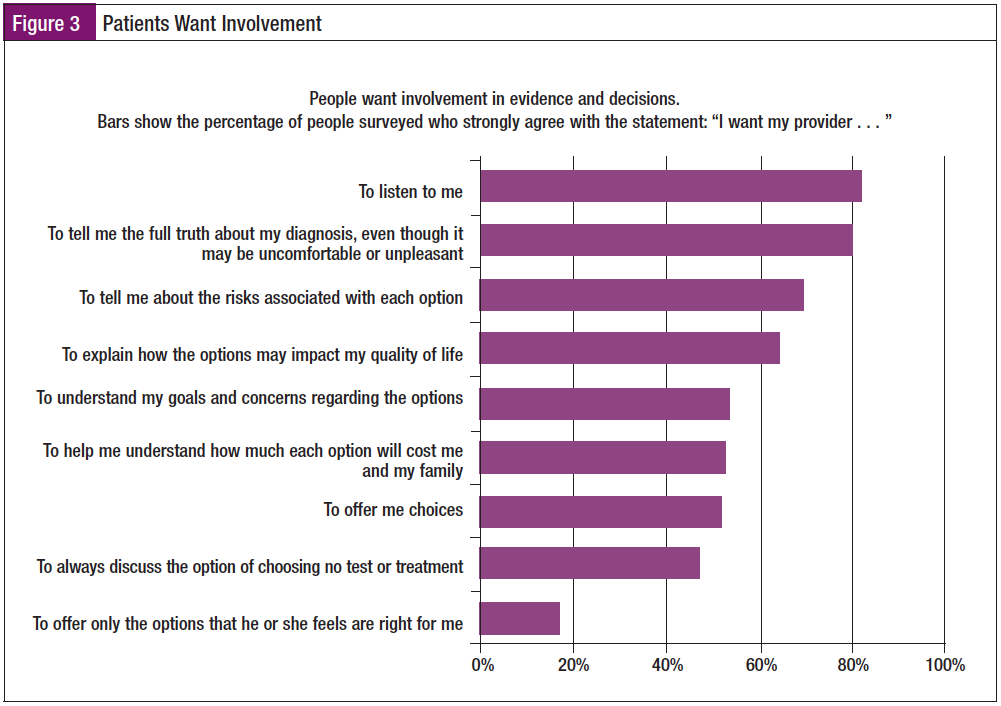
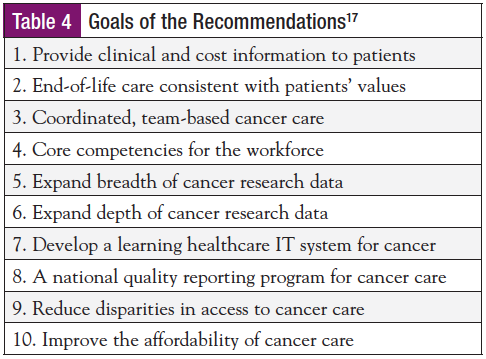
QOPI has standardized best practices in regard to PE, CO, and ROI. These metrics assist medical oncologists and their staff with facilitating critical conversations with their patients, such as their goals of care and treatment wishes, and fruitful open discussions about clinical treatment options and outcomes. These conversations are extremely valuable from the patients’ perspective. The IOM noted in its report, Delivering High-Quality Cancer Care: Charting a New Course for a System in Crisis,17 that the patients want involvement. The number 1 response from patients when asked “What do you want from your provider?” was “I want my provider to listen to me” (Figure 3). Patients want more than ever to have their voices heard, and they want the best clinical care and their life goals discussed. Having these conversations earlier in the continuum provides superb clinical care and supports patient- and family-centered care. Achieving excellence in cancer care is a goal of QOPI, keeping the patient and family involved with discussions and providing the highest level of quality across the entire continuum of care. QOPI certification demonstrates the physician commitment to quality oncology care to the patient and their family in regard to national standards. When reviewing the goals from the IOM, the first
and second goals are directly related to the patient (Table 4).17
QOPI is a voluntary program to help medical oncology and hematology/oncology practices evaluate the quality of the care they provide to patients. Data are collected and compared with more than 100 quality measures (aspects of care based on published care recommendations and expert opinion). To achieve QOPI certification, a practice must have participated in QOPI and met or exceeded a benchmark score on measures that compared the quality of its care against national standards. A practice then undergoes an on-site review and peer review by a select team of oncology professionals, such as physicians and nurses, at least once every 3 years. Certification is awarded when a practice meets the QOPI Certification Program standards.16
MACRA
MACRA is legislation signed into law April 16, 2015. MACRA created the Quality Payment Program (QPP) that repeals the sustainable growth rate formula, changes the way Medicare rewards clinicians for value over volume, streamlines multiple quality programs under the new Merit-based Incentive Payment System (MIPS), and gives bonus payments for participation in eligible Alternative Payment Models (APMs).18
The MACRA QPP includes quality improvement activities, advancing care information, and cost.19
The landmark passage of MACRA marked one of the most significant changes to Medicare legislation the healthcare industry has seen.
Clinicians can adopt 2 reporting tracks when participating in MACRA—MIPS and APMs.20
MIPS indicators are not entirely foreign to providers; they are used as measures included in meaningful use and the Physician Quality Reporting System.
APMs is a payment approach that gives added incentive payments to provide high-quality and cost-efficient care. APMs can apply to a specific clinical condition, a care episode, or a population.20
A review of the MIPS/APMs indicators shows that they cross all AONN+ domains. For example, they address clinical coordination of care, operations management, community screening, psychosocial screening, and survivorship, also known as patient self-management. MIPS/APMs metrics also are very similar to the QOPI indicators with regard to PE, CO, and ROI.
The foundation of the MIPS and APMs programs is the delivery of high-quality patient care. Using a variety of tools, physicians report data to CMS, receive valuable feedback about their practice, and are eligible for payment adjustments.
How does the QPP benefit clinicians and patients? The clinicians benefit from streamlined reporting, standardized measures (evidence-based), and eliminated duplicative reporting, which allow them to spend more time with patients, promote industry alignment through multipayer models, and incentivize care that focuses on improved quality outcomes. The patients benefit by increased access to better care, enhanced coordination through a patient-centered approach, and improved results.20
The payment model will be based on quality performance during a 90-day episode of care. The QPP incentivizes providers to participate, utilizing their indicators of choice and ensuring high-quality care through incentive payments from Medicare.
The QPP Strategic Goals20
- Improve beneficiary outcomes
- Increase adoption of advanced APMs
- Improve data and information sharing
- Enhance clinician experience
- Maximize participation
- Ensure operational excellence in program implementation
Summary
Whereas oncology navigation programs have been in existence for decades, there is an evident gap in the literature around metrics. This gap has resulted in the lack of solid benchmarks and limited research in navigation. Navigation services are not reimbursable to date, and administrators need to take the lead with their navigation programs to create metrics that support value-based cancer care.21 Value-based cancer care metrics for an oncology program need to include national oncology guidelines such as CoC and NAPBC, oncology national quality standards such as QOPI, and payment modules such as OCM and MIPS/APMs that support PE, CO, and ROI.
In today’s healthcare landscape, it is essential for cancer programs to harmonize their performance improvement initiatives or create “metric synergy.” Presently, providers, administrators, clinical trials departments, and navigation programs are all collecting metrics in silos. There is strength and sustainability in synergy. As oncology resources become more limited and oncology physicians fewer in number, it will be essential that each provider and midlevel and professional staff member work to the top of their licensure in their state. The creation of standing order sets, pathways, and guidelines will support value-based cancer care metrics and be essential ingredients to oncology programs. Processes and role delineation will ensure the team is functioning to its highest level with the patient and their family in the center, resulting in clinical excellence, the ultimate goal.
When collecting metrics, it is essential that each team member understands the program goals and performance improvement metrics to achieve these goals. Each team member is a vital link to enhancing the cancer program, thus all have a specific role when it comes to incorporating metrics into the day-to-day operations of the cancer program. Providers, administrators, and oncology program department heads need to discuss the goals of their cancer program and select metrics that support these goals. The goals then need to be shared with every staff member in the cancer program. Each staff member needs to be fully aware of the cancer program metrics, the definition, the desired outcome, and the benefits of meeting and exceeding the metrics. The ultimate goal for the program is to provide the highest level of engaged patient- and family-centered care with clinical outcomes resulting in a high ROI.
References
1. Barnsteiner J, Reeder VC, Palma WH, et al. Promoting evidence-based practice and translational research. Nurs Adm Q. 2010;34:217-225.
2. Crane-Okada R. Evaluation and outcome measure in patient navigation. Semin Oncol Nurs. 2013;29:128-140.
3. Guadagnolo B, Dohan D, Raich P. Metrics for evaluating patient navigation during cancer diagnosis and treatment: crafting a policy-relevant research agenda for patient navigation in cancer care. Cancer. 2011;117(15 suppl):3565-3574.
4. Centers for Medicare & Medicaid Services. NHE Fact Sheet. www.cms.gov/research-statistics-data-and-systems/statistics-trends-and-reports/nationalhealthexpenddata/nhe-fact-sheet.html. Accessed May 1, 2018.
5. Institute of Medicine. Crossing the Quality Chasm: A New Health System for the 21st Century. Washington, DC: National Academies Press; 2001.
6. Institute of Medicine. The Future of Nursing: Leading Change, Advancing Health. Washington, DC: National Academies Press; 2010.
7. Institute of Medicine. Ensuring Quality Cancer Care. Washington, DC: National Academies Press; 1999.
8. Jojola CE, Cheng H, Wong LJ, et al. Efficacy of patient navigation in cancer treatment: a systematic review. Journal of Oncology Navigation & Survivorship. 2017;8:106-115.
9. Commission on Cancer. www.facs.org/quality-programs/cancer/coc. Accessed May 1, 2018.
10. Commission on Cancer. CoC Member Organization Activities. https://www.facs.org/quality-programs/cancer/coc/about/activities. Accessed May 1, 2018.
11. Commission on Cancer. Cancer Program Standards: Ensuring Patient-Centered Care. www.facs.org/~/media/files/quality%20programs/cancer/coc/2016%20coc%20standards%20manual_interactive%20pdf.ashx. 2016.
12. National Accreditation Program for Breast Centers. Standards Manual. 2018 Edition. https://accreditation.facs.org/accreditationdocuments/NAPBC/Portal%20Resources/2018NAPBCStandardsManual.pdf. Accessed May 1, 2018.
13. Centers for Medicare & Medicaid Services. Oncology Care Model. https://innovation.cms.gov/Files/x/ocmrfa.pdf. Accessed May 4, 2018.
14. Centers for Medicare & Medicaid Services. Oncology Care Model. https://innovation.cms.gov/initiatives/Oncology-Care. Accessed May 1, 2018.
15. Oncology Care Model. OCM Performance-Based Payment Methodology. Version 2.1. December 27, 2017. https://innovation.cms.gov/initiatives/Oncology-Care.
16. Cancer.net. www.cancer.net/about-us/about-asco/about-qopi%C2%AE-certification-program. Accessed April 30, 2018.
17. Institute of Medicine. Delivering High-Quality Cancer Care: Charting a New Course for a System in Crisis. Washington, DC: National Academies Press; 2013.
18. Centers for Medicare & Medicaid Services. www.cms.gov. Accessed April 30, 2018.
19. The Health Management Academy and PerfectServe. Making Sense of MACRA. www.perfectserve.com/macra-webinar. March 2017.
20. Centers for Medicare & Medicaid Services. The Merit-based Incentive Payment System: MIPS Scoring Methodology Overview. March 2017. www.cms.gov/Medicare/Quality-Initiatives-Patient-Assessment-Instruments/Value-Based-Programs/MACRA-MIPS-and-APMs/MIPS-Scoring-Methodology-slide-deck.pdf.
21. Strusowski T. Creating value in cancer care through standardized metrics and partnerships. Journal of Clinical Pathways. 2018;4(3):42-47.
